.png)

How would existing and future jobs change if the Northwest were on the path to net-zero emissions?
The NZNW Workforce analysis is the Northwest’s first comprehensive clean energy workforce analysis. The study examined the jobs to be created or displaced if the Northwest were to achieve net-zero emissions, as modeled in the NZNW Energy Pathways analysis, by occupation and industry in the buildings, fuels, electricity, and transportation sectors throughout the region.
Explore Workforce Analysis Key Findings and the Technical Report or click on any of the Results sections below to learn the impact on jobs if the Northwest were to achieve net-zero emissions by 2050.
In November 2023, CETI released regional workforce findings, which are discussed on this page. Then in April 2024, CETI added state-specific results, which can be seen on the State Analysis page or by selecting the view by state in the interactive figures below.
We invite you to join our community, provide feedback, request a briefing, or support our work.
Northwest Stands to Gain Jobs with Clean Energy Transition
Clean energy jobs in the United States are growing at a faster rate than jobs in the rest of the economy, a growth rate likely spurred by geopolitical factors, state and local climate policies, and federal funding—notably the CHIPS and Science Act, the Bipartisan Infrastructure Law (BIL), and the Inflation Reduction Act (IRA), which are making clean energy technologies more economically feasible.
This analysis offers insights into Northwest clean energy employment as the region aims to achieve net-zero emissions by 2050, with a focus on the next seven years through 2030. The job numbers in the following bullets include direct, indirect, and induced jobs. See Energy Subsector Descriptions and Example Jobs for more detail about each sector and subsectors. The following key themes emerged:
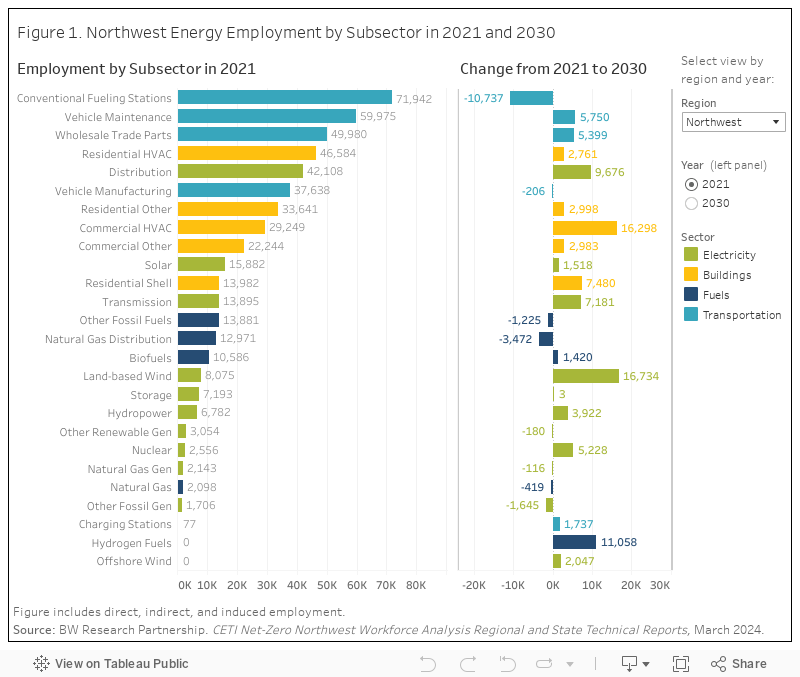
- The Electricity sector supports a 43% job growth (nearly 44,400 jobs) between 2021 and 2030, driven by increases in Land-based Wind, Transmission, Distribution, and Solar.
- Despite job displacement in fossil fuel subsectors, the Fuels sector supports a 19% net increase (nearly 7,400 jobs) between 2021 and 2030. Hydrogen drives this growth, adding more than 11,000 jobs, while Biofuels adds more than 1,400.
- Between 2021 and 2030, the Buildings sector supports a 22% employment increase (over 32,500 jobs), driven largely by Commercial HVAC and Residential Shell jobs. In fact, all Buildings subsectors are projected to grow as energy efficiency and building electrification and decarbonization efforts ramp up.
- Employment supported by the Transportation sector increases by about 1% (approximately 2,000 net jobs) between 2021 and 2030, reflecting decreases in employment in Conventional Fueling Stations and, to a lesser extent, Vehicle Manufacturing, along with net growth in Vehicle Maintenance, Wholesale Trade Parts, and Charging Stations.
- For all sectors, it will be critical to promote strategies such as labor union pathways, prevailing wage requirements, apprenticeships, and project labor agreements to ensure job quality is a priority in the transition to a clean energy economy.
Historical Trends in Northwest Clean Energy Employment
Based on the U.S. Energy & Employment Jobs Report (USEER), in 2022 the four Northwest states employed nearly 158,000 clean energy workers across renewable electric power generation, grid and storage, energy efficiency, clean fuels, and alternative technology transportation, a 2.8% increase from the previous year. Of these, energy efficiency comprised the majority of clean energy jobs (73%), followed by renewable electric power generation (13%). Alternative transportation and grid and storage each account for another 6% of the region’s clean energy workforce, with clean fuels responsible for the remaining 2%.
Washington state accounted for half of all clean energy workers in 2022 in the Northwest, with Oregon employing 35%, and Montana and Idaho supporting the remaining 15%.
From 2017 through 2019, clean energy employment in the region increased by 4%. In 2020, during the COVID-19 pandemic, clean energy jobs suffered a 9% decline, most of which was due to decreased employment in energy efficiency. Since 2020, the Northwest’s clean energy workforce has increased by 6%, back to 2017 levels. While there is more employment now than before the pandemic in alternative transportation and grid and storage, employment in energy efficiency has yet to make a full recovery.
Northwest Energy Employment Experiences Net Growth from 2021 to 2030
This analysis found that Northwest energy employment would grow by 17% from 2021 to 2030—largely driven by increases in Distribution, Commercial HVAC, Land-based Wind, and Hydrogen jobs—if the region were on the path to achieving net-zero emissions by 2050. Figure 1 below shows employment across direct, indirect, and induced jobs in all energy subsectors in this analysis and the net change between 2021 and 2030.
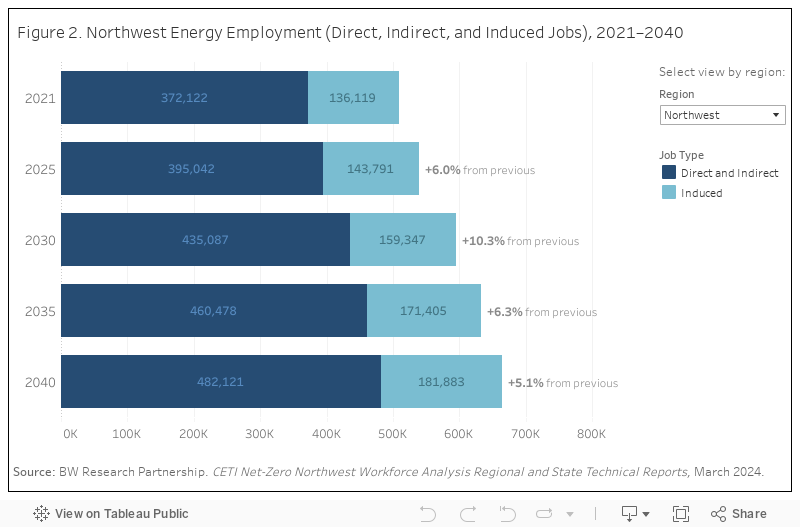
As seen in Figure 2 below, Northwest energy employment, including induced jobs, grows between 6%-10% every five years between 2021 and 2040. Induced jobs comprise approximately 27% of the total energy employment in each year, and while not energy jobs per se, they point to the broader effects of energy investment on the local economy.
Electricity and Buildings Sectors Drive Job Growth, Largely in the Construction and with Installation/Repair Occupations
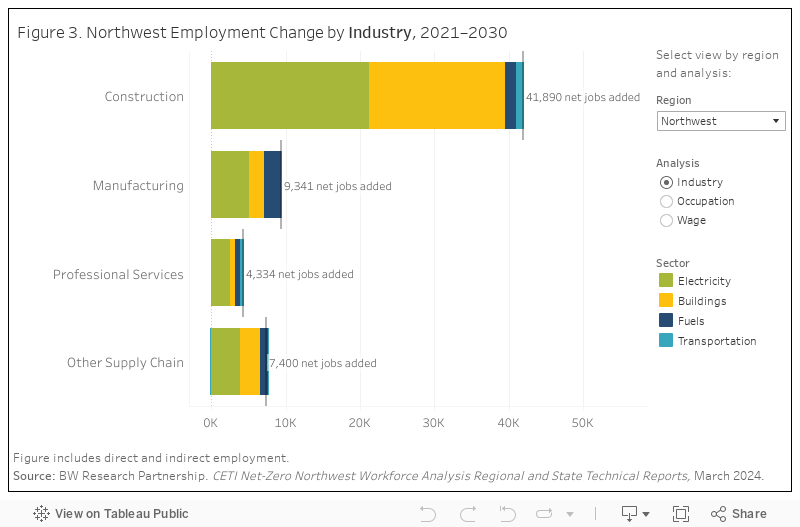
Figure 3 below shows the change in direct and indirect jobs in each of the four Northwest energy sectors from 2021 to 2030, with an interactive dropdown menu to see jobs grouped by industry, occupation, or wage, with the following key takeaways:
- Industry: Construction job growth dominates, largely in the Electricity and Buildings sectors, with additional significant growth in Manufacturing jobs, followed by Other Supply Chain and Professional Services jobs. The dramatic increase in demand for construction and manufacturing workers comes from new installed generating capacity, building electrification work, new hydrogen and biofuel production, and installation of electric vehicle charging stations.
- Occupation: Installation/Repair jobs grow the most, followed by Management/Professional occupations, again driven by growth in Electricity and Buildings jobs. Administrative jobs in the Transportation sector decline due to the diminished need for Conventional Fueling Station workers.
- Wage: The majority of net job growth is in the lowest and middle wage tier, pointing to the importance of intentional planning for job quality in this transition.
Growing Clean Energy Demand Will Require Training and/or Transitioning Workers
While the overall trends in Figure 3 (above) are consistent across sectors, each sector requires slightly different workforce development strategies. For instance, residential building work will require smaller, retail-based electricians, HVAC technicians, and other specialty trade contractors that have specific knowledge of energy-efficient technologies found in buildings and homes, while utility solar and wind projects will require electricians and technicians with specialized knowledge of larger generation systems.
There are several workforce development strategies to highlight here: First, it will be important to leverage apprenticeship programs, which are paid positions with on-the-job training and additional instruction, that already exist for many construction trade occupations to help train new and legacy workers quickly and effectively. Pre-apprenticeship programs are another important tool designed to prepare workers for entry into apprenticeship programs and usually target underrepresented demographics, helping to move people off the economic sidelines into apprenticeships.
Increasing access to community colleges and vocational programs is another important step for making training resources more widely available and bringing workers into clean energy roles. The growth in jobs and decarbonization investments presents an opportunity to focus efforts on underserved communities to capture the entirety of the region’s talent and spread economic benefits to populations who have been marginalized and under-resourced.
In addition to training new workers, displaced workers will need retraining to transition into emerging employment areas. Early, intentional planning that develops prevailing wage jobs in emerging clean energy fields and involves workers impacted by the transition away from fossil fuels is critical to avoid otherwise devastating effects of fossil fuel layoffs. This analysis illuminates several areas for further consideration in terms of transitioning from fossil fuel to clean energy jobs in the Northwest:
- Electricity: Natural Gas Generation and Other Fossil Generation (coal, oil, and other fossil fuel burning plants) experience net decreases in employment as renewables take over as sources of electricity generation. After 2035, the NZNW Energy Pathways modeling assumes that new gas generating capacity will use biomass methane gas, which could open transition opportunities for current natural gas generation workers, as the facilities themselves could remain in place but the fuel would switch from natural gas to biomass methane gas. This may require retraining workers on new processes and day-to-day operating, but there would likely be many transferable skills.
- Fuels: This sector also offers opportunities to make use of available skilled labor and to mitigate negative impacts to workers in the transition. Resources should be allocated specifically toward training and transitioning displaced Natural Gas, Natural Gas Distribution, and Other Fossil Fuel workers into new opportunities, such as the production, distribution, and storage of Hydrogen and Biofuels—two Fuels subsectors that grow substantially by 2030. A complicating factor could be location: the NZNW Energy Pathways-Clean Fuels analysis found that it would be economic to co-locate production of hydrogen and subsequent clean fuels with high-quality renewable resources, which may not exist in the same locations as workers from natural gas and fossil fuel jobs.
- Buildings: All subsectors experience net job growth, so there is less of a concern about transitioning displaced workers. However, there is still a significant need for educating and potentially re-training existing workers to install lower-carbon versions of HVAC technology and appliances (heat pumps, high-efficiency building shells, etc.).
- Transportation: This sector’s decarbonization transition must take into account the uncertainty surrounding conventional fueling station workers as demand for conventional fuel drops and new charging station technologies expand. There are also concerns from autoworkers about the impact of the electric vehicle transition on high-quality union jobs in the automotive sector.
Ensuring Job Quality is Critical
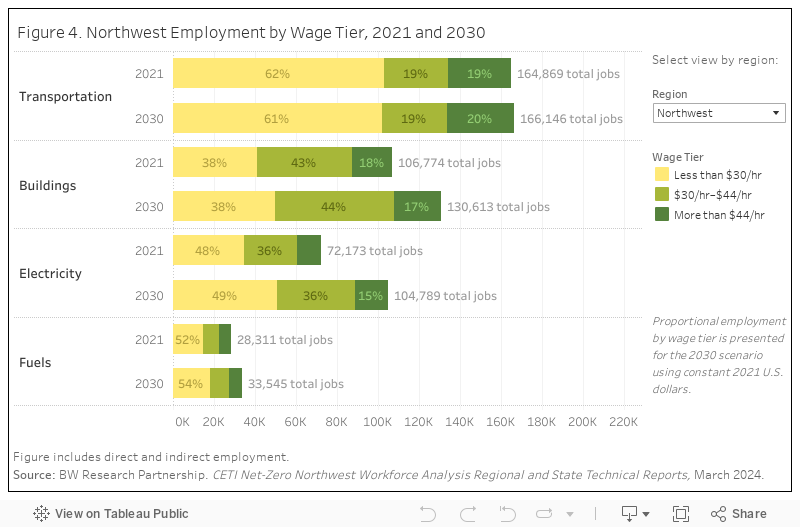
Figure 4 shows distribution of jobs by wage tier for each sector in 2021 or 2030 (select year from dropdown menu). The tiers are less than $30 an hour, $30-$44 an hour, or more than $44 an hour, and were derived by BW Research based on the MIT Living Wage Calculator at median living wages for different living circumstances in each of the four Northwest states, weighted by employment in each state. The modeling team relied on this national source to maintain consistency across the four Northwest states, rather than introduce state-specific sources.
Half of all clean energy jobs in 2030 are in the lowest wage tier, pointing to the importance of intentional planning for job quality in this transition. (While only 2030 is shown in this figure, it is important to note that the percentage of workers in each wage tier does not change significantly between 2021 and 2030).
There are various strategies—including labor union pathways, prevailing wage requirements, registered apprenticeships, and project labor agreements—that could promote good-paying, fair jobs in emerging clean energy sectors and bring economic development to a wide range of communities that have historically been left out economically. Through the IRA, the federal government has taken significant steps to ensure that clean energy investment creates quality jobs. One mechanism in the IRA is a bonus tax credit that links prevailing wage and registered apprenticeship requirements to the level of clean energy tax incentive available.
Conclusion
The NZNW Workforce analysis offers regional policymakers direction for how employment would shift over time as the region moves toward attaining a net-zero emissions goal by 2050. While fossil fuel-related jobs would decline, on balance net energy jobs in the Northwest would grow by 17% between 2021 and 2030. The question for the region’s stakeholders is how to manage the transition to clean energy in such a way that as many people as possible benefit, either by having access to jobs that were previously foreclosed or by receiving training that would enable them to learn new skills and maintain a good standard of living.

.png)


BW Research uses two models to estimate the impact that achieving net-zero emissions by 2050 in the Northwest would have on employment for construction and operations at both the state and regional level: (1) Economic Impact Analysis for Planning (IMPLAN), and (2) NREL’s Jobs and Economic Development Impact (JEDI).
BW Research applies the data output from Evolved Energy Research (Evolved)’s NZNW Energy Pathways analysis to these two models to produce regional and state outputs for the electricity, fuels, buildings, and transportation sectors.
Sector Framework
BW Research categorizes employment in the following four sectors (please see Workforce Analysis Methodology, pages 3-6 for the list of sub-sectors.)
Energy Supply:
Within the Electricity sector, BW Research identifies 11 sub-sectors, nine that are likely to grow and two that are likely to be displaced.
Within the Fuels sector, BW Research identifies five sub-sectors, two that are likely to grow and three that are likely to be displaced.
Energy Demand:
Within the Buildings sector, BW Research identifies five sub-sectors, all of which are likely to grow.
Within the Transportation sector, BW Research identifies five sub-sectors, two that are likely to grow and three that are likely to be displaced.
Data Sources
BW Research uses the following data sources for model inputs:
USEER (DOE) & relevant complementary labor market data (BLS) to establish baseline (2021) employment in each sub-sector.
Transition scenario-specific investment data (Evolved) for each sub-sector and in each general region, over time (2025-2050). (The electricity sector also includes energy generated over time).
Sub-sector specific research (literature review and industry research done by BW Research) on supply chains to quantify changing employment patterns based on recent investments and (de)commissioning plans.
The following graphic show how BW Research flows data through its model inputting process:

Modeling Framework
The following graphic shows how BW Research’s modeling process is constructed:

BW Research’s process from start to finish is as follows:
Determine unit inputs: From Evolved data. Examples of inputs include appliance or device stocks and sales; megawatts of electricity capacity; exajoules of fuels.
Determine unit and total costs: From Evolved data where provided, additional costs may be assumed from secondary sources.
Split costs into industry category by technical costs data: Segment overall costs from Evolved into industries based on activity using secondary data sources. Examples include installation of efficiency measures, manufacturing of electric vehicle batteries, etc.
Apply multipliers: Input five-year-increment costs into IMPLAN/JEDI industry multipliers based on the above cost allocation.
Report: Jobs created through additions reported out in five-year increments.
The employment data outputs include direct, indirect, and induced changes in the four primary sectors (electricity, fuels, buildings, and transportation). BW Research does not use a general equilibrium macroeconomic model that measures all potential changes in the economy. Hence, the outputs do not include jobs throughout the entire economy, nor those in parts of the employment supply chain that are not connected to the four primary sectors.
BW Research reports out Initial Employment Outputs (IEOs) for the four sectors for seven benchmark years in five-year increments (2021, 2025, 2030, 2035, 2040, 2045, 2050) by state, sub-sector, sector, and overall. The IEOs include direct, indirect, and induced employment impacts, disaggregated by industry group. Industry groups included are construction, professional services, manufacturing, and other supply chain (utilities, wholesale trade, repair and maintenance, etc.).
BW Research then provides Secondary Employment Outputs (SEOs), which offer occupational wage data for direct and indirect jobs for the region as a whole, and Washington and Oregon specifically. To complete this analysis, BW Research performs staffing patterns (industry/NAICS to occupation/SOC) for each of the industry groups within each sub-sector for 2021 and 2030.

The following assumptions are used in BW Research’s Net-Zero Northwest (NZNW) Workforce Analysis.
Baseline Employment Data
BW Research starts the NZNW Workforce analysis with baseline employment from 2021 for the four sectors it models—Energy Supply: Electricity and Fuels, Energy Demand: Buildings and Transportation—with the 26 sub-sectors as seen in the table below. These baseline employment figures were derived from extrapolating state-level data from the 2022 U.S. Energy Employment Report (USEER).

Additional baseline employment assumptions are detailed as follows:
Electricity Transmission and Distribution employment in the USEER is split by Bureau of Labor Statistics (BLS) employment in North American Industry Classification System (NAICS) 221121 Electric Bulk Power Transmission and Control and 221122 Electric Power Distribution.
Buildings sub-sectors are split between residential and commercial using BLS data in relevant construction NAICS.
Baseline employment for natural gas distribution begins with BLS employment in NAICS 22121 and supply chain employment is derived through the Economic Impact Analysis for Planning (IMPLAN) model.
Baseline employment for transportation sub-sectors begins with USEER motor vehicle employment in a specific industry and supply chain employment is derived through IMPLAN.
Offshore wind and hydrogen fuels are not included in USEER data, so baseline employment is 0. Charging stations are also not included in USEER data; however, nominal baseline employment is calculated using IMPLAN.
Electricity
For the Electricity sector, BW Research applied the data outputs from the NZNW Energy Pathways modeling that Evolved Energy Research (Evolved) performed and assumed the following data sources:
Solar: Industry distribution of Evolved investments using data from NREL’s U.S. Solar Photovoltaic System and Energy Storage Cost Benchmark: Q1 2020. Assumptions came from the following figures in NREL’s dataset:
Distributed solar capital expenditures (CAPEX) investments are input into data derived from a weighted average of the 7kW mixed residential model (figure 12) and the 0.2MW commercial ground mount model (figure 22), and operations and maintenance (O&M) investments are input into data derived from the weighted average of the residential and commercial ground mount models (figure 10).
Utility solar CAPEX investments are input into data derived from the single axis tracker 100MW model (figure 30), and O&M investments are input into data derived from the tracking model (figure 10).
Offshore wind: Evolved’s capacity additions modeled using NREL’s Offshore Wind Jobs and Economic Development Impacts (JEDI) model, local content scenarios derived from review of NREL’s Offshore Wind Supply Chain Roadmap and coordination with NREL.
Land-based wind: Evolved’s capacity additions modeled using NREL’s Land-Based Wind JEDI model, using default local content values.
Hydropower, Other Renewable Generation: Evolved’s capital investments input into the construction of power structures IMPLAN code, O&M investments input into hydropower, and biomass electricity generation IMPLAN code.
Distribution, Transmission: Evolved’s capital investments input into the construction of power structures IMPLAN code and O&M investments input into electricity transmission and distribution IMPLAN code.
Storage: Industry distribution of Evolved’s investments using NREL’s U.S. Solar Photovoltaic System and Energy Storage Cost Benchmark: Q1 2020 using the 60MW, 4hr standalone Li-ion model.
Natural Gas Generation: Evolved’s capacity retirements used to scale 2021 baseline employment, capacity additions from 2040 onward assumed as combustion fueled by biomass-derived methane.
Other Fossil Generation: Evolved’s capacity retirements used to scale 2021 baseline employment.
Nuclear: Evolved’s capacity changes used to scale 2021 baseline operational employment; capital investments input into the construction of power structures IMPLAN code.
Fuels
Hydrogen: Industry allocation of Evolved’s investments are derived from the 2020 Peterson et al report, Hydrogen Production Cost From PEM Electrolysis – 2019 from the U.S. Department of Energy (DOE) Hydrogen and Fuel Cells Program Record.
Biofuels: Industry allocation of Evolved’s investments for biofuels are derived from the NREL Biorefinery Sugars to Hydrocarbon JEDI model.
Natural Gas, Other Fossil Fuels: Evolved’s fuel demand used to scale 2021 baseline employment.
Natural Gas Distribution: Evolved’s fuel demand from residential and commercial end-use used to scale 2021 baseline employment.
Buildings
Commercial and Residential HVAC: Industry spending patterns are adjusted to allocate supply chain expenditures to the following commodities:
Air conditioning, refrigeration, and warm air heating equipment
Sheet metal
Fabricated pipes and pipe fittings
Power boilers and heat exchangers
Residential Shell: Industry spending patterns are adjusted to allocate supply chain expenditures to the following commodities:
Paints and coatings
Mineral wool (insulation)
Metal windows and doors
Wood windows and doors
Commercial and Residential Other: Industry spending patterns are adjusted to allocate supply chain expenditures to the following commodities:
Household laundry equipment
Household refrigerators and home freezers
Lighting fixtures
Heating equipment (except warm air furnaces)
Other major household appliances
Household cooking appliances
Air conditioning, refrigeration, and warm air heating equipment
Transportation
Vehicle Manufacturing: Evolved’s vehicle sales data are used to scale 2021 baseline employment, only employment specific to internal combustion engine vehicles and activity serving local economy impacted by scale.
Wholesale Trade Parts: Evolved’s vehicle stock data used to scale 2021 baseline employment, only percent of activity serving local economy impacted by scale.
Charging Stations: Evolved’s vehicle stock data and NREL’s Electrification Futures Study are used to estimate annual charger device stocks. Industry allocation of Evolved’s charger investments derived from International Council on Clean Transportation. Expected maintenance hours per year per charger are derived from the U.S. DOE Alternative Fuels Data Center.
Vehicle Maintenance: Investments in vehicle maintenance are derived from Evolved’s projected vehicle miles traveled and maintenance costs (e.g., engine, braking system, transmission, etc.) from a 2021 Argonne National Laboratory report, Comprehensive Total Cost of Ownership Quantification for Vehicles with Different Size Classes and Powertrains.
Conventional Fueling Stations: Baseline 2021 employment scaled by Evolved’s fuel demand by transportation sector.
61% of fueling stations with convenience stores are impacted by change in fuel demand (61% of revenues are related to fuel sales - National Association of Convenience Stores).
All employment at fueling stations without convenience stores is subject to change in fuel demand.
Secondary Employment Outputs (SEOs) Wage Analysis
BW Research performs a wage analysis after completing the SEOs using the following assumptions.
Using finalized staffing patterns and proportional employment within sub-sector and value chain categories, wages provided by the BLS Occupational Employment and Wage Statistics (OEWS) data series are grouped into three tiers:
Tier 1: Above a sustaining wage (more than $44/hr)
Tier 2: At a sustaining wage (between $30 and $44/hr)
Tier 3: Below a sustaining wage (under $30/hr)
Proportional employment by wage tier is presented for 2021 and 2030 scenarios using 2021 dollars.
The wage brackets are derived from living wage data from the Massachusetts Institute of Technology (MIT) Living Wage Calculator, based on the median of living wages from different living circumstances (0 children, 1child, 2 or more children), weighted by employment in Idaho, Montana, Oregon, and Washington, which is $36.28.
The technical documentation included with the MIT Living Wage Calculator data advises against reporting specific wage data at the state level, so BW Research devised a margin around the $36.28 figure to allow for differences in living conditions and costs. The range for Tier 2 is 1 standard deviation around the median.


