
How would the Northwest energy system change to achieve net-zero emissions by 2050?
The NZNW Energy Pathways analysis was completed in June 2023 and offers policymakers a rich array of economy-wide, four-state data to inform conversations about how and where to invest in creating a net-zero emissions future for Idaho, Montana, Oregon, and Washington.
The study explores a Core Case and 22 scenarios in the context of the 11-Western state grid and incorporates the Inflation Reduction Act to probe the way that pursuing net-zero emissions would impact aspects of the region’s energy system over the coming decades.
Explore Energy Pathways Key Findings and the Full Technical Report or click on any of the Results sections below to learn how the energy system would change if the Northwest were to achieve net-zero emissions by 2050.
We invite you to join our community, provide feedback, request a briefing, or support our work.
Energy efficiency, clean electricity, clean fuels, and capturing carbon are the key strategies to achieve net-zero emissions in the Northwest.
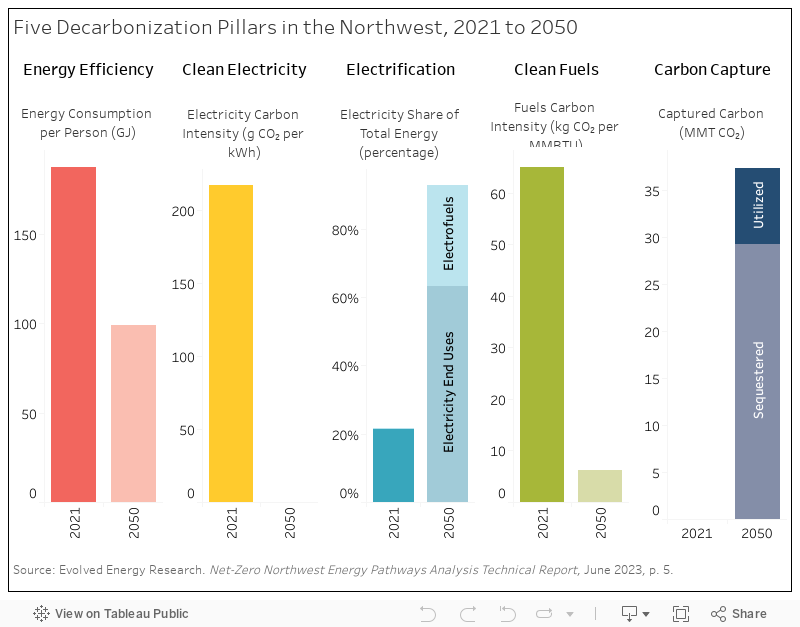
Decarbonization hinges on the interaction of the five decarbonization pillars: energy efficiency, clean electricity, electrification, clean fuels, and carbon capture. The figure below depicts how each of these key strategies change from 2021 to 2050 as the Northwest pursues a net-zero emissions reduction target.
Northwest Poised to Lead on Decarbonizing Clean Fuels
Several factors suggest that the Northwest region of the United States has the potential to lead the nation in developing decarbonization strategies, particularly clean fuels. First, the region’s renewable resources could be used to decarbonize many transportation, building, and industrial sector uses, assuming new resources and transmission can be built.
Second, because the region has a relatively clean grid to begin with, it will not be able to reduce emissions from the electricity sector by removing coal and gas generation by 2030 as other parts of the country can. This means the Northwest must focus on developing clean fuels in the 2020s.
Third, regional emissions reduction policies, particularly Washington’s ambitious 45% below 1990 levels by 2030 target, make clean fuels development imperative. To achieve its ambitious goals, the state must focus on both developing and importing clean fuels from outside the region in the 2020s.
Federal Funding Boosts Nascent Clean Energy Technologies
The Inflation Reduction Act (IRA), signed into law in August 2022, and to a lesser extent, the Bipartisan Infrastructure Law of November 2021, are providing significant incentives to boost the development of clean fuels—hydrogen and hydrogen-derived fuels in particular—as well as other critically important nascent technologies.
The NZNW Energy Pathways analysis incorporates the IRA incentives and finds that clean energy solutions previously not economic until the 2040s and 2050s are economically viable in the 2030s. These include electrolysis, direct air capture (DAC), and nuclear energy.
Siting and Permitting Will Shape the Northwest’s New Energy Map
The renewable projects and transmission expansion that are permitted and sited will shape electricity and fuels in the Northwest. The NZNW Energy Pathways analysis finds that new clean electricity loads and fuels production will drive a total of 138 GW of new renewables by 2050—92 GW of wind and 46 GW of solar—throughout the region. Expanding transmission across the Northwest lowers total decarbonization costs and increases options for meeting net-zero goals by 2050.
The study shows where the region will need transmission, so efforts should be made now to develop coordinated planning across the Northwest with authentic community engagement. Without both, it is unlikely that an integrated energy system across geographies will be developed to provide the clean electricity and clean fuels that the region's buildings, transportation, and industrial sectors will require to achieve a net-zero emissions future.
Efficiency Due to Electrification Key to Minimizing Decarbonization Costs
Efficiency gains, mostly from fuel switching to electricity, drive an overall decrease in energy use from 188.71 gigajoules per person (GJ/person) in 2021 to 99.16 GJ/person in 2050.
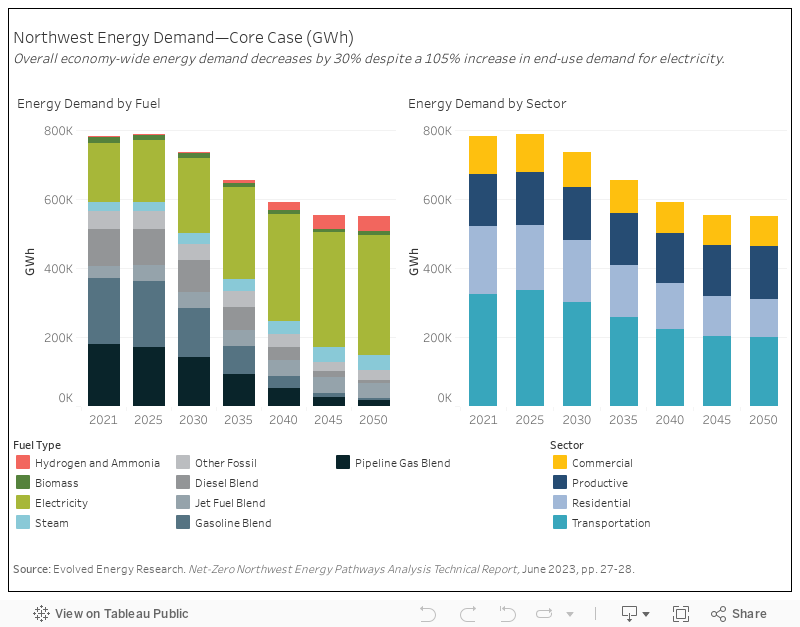
Overall economy-wide demand for energy drops by 30% between 2021 and 2050, primarily due to the efficiency gains that come from fuel switching to electricity. This is because electricity is inherently more efficient than fossil fuels in many applications in the economy, notably in vehicle motors and heating in buildings, and therefore lowers energy consumption per mile driven or per set point on the thermostat.
Transportation efficiency contributes the most to reducing energy demand. Electric drivetrains are highly efficient compared to the internal combustion engines they replace. Residential and commercial appliances also see significant efficiency gains with fuel switching to electric heat pumps, which are far more efficient than both electric resistance heat and gas furnaces.
Electricity Grid is Fully Decarbonized by 2050
The electricity sector is fully decarbonized by 2050, going from 217 grams of CO2 per kilowatt hour (g CO2/kWh) to 0 g CO2/kWh in 2050.
New capacity is built where the best resources are located. This includes onshore wind for hydrogen production and electricity exports in Montana; offshore wind in Oregon; Washington renewables developed mostly after 2035; and nuclear SMRs retrofit retiring coal and gas in Idaho. All development will depend on siting and permitting.
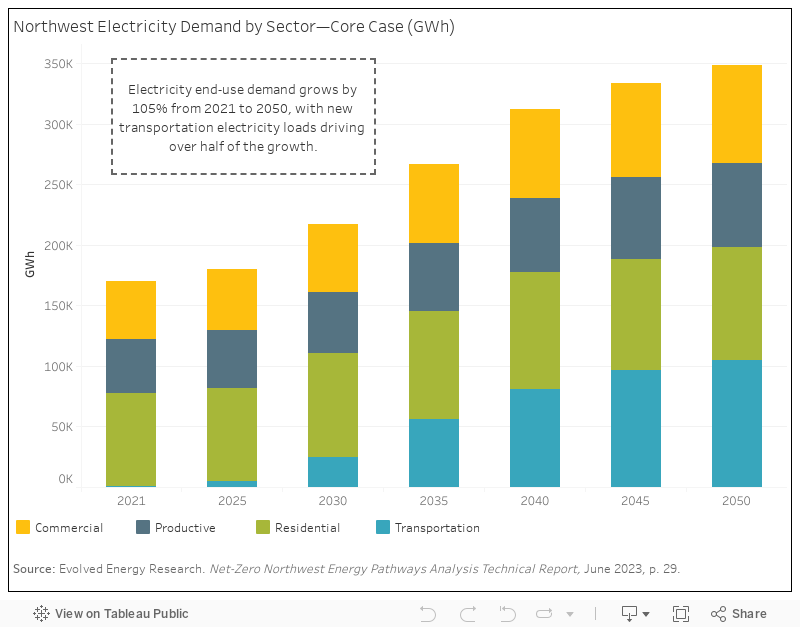
End-use Demand for Electricity More than Doubles from 2021 to 2050
As seen in the figure below, end-use demand for electricity grows by 105% from 2021 to 2050. While all sectors see increases in electricity demand, transportation electrification drives just over half of that growth as electric vehicles replace fossil-fuel powered vehicles.
Clean Fuels—Especially Hydrogen and Hydrogen-Derived Fuels—Critical to Decarbonization
By 2050, the supply of liquid fuels is fully decarbonized with electrofuels (Fischer-Tropsch liquids in this study) and some ammonia, and almost all gaseous fuels are clean hydrogen or biofuels. Along with hydrogen, captured carbon also becomes a valuable commodity in a net-zero economy because it is used to produce clean, drop-in synthetic hydrocarbon fuels such as Fischer-Tropsch liquids.
Carbon Capture and Sequestration Required for Net-Zero Emissions
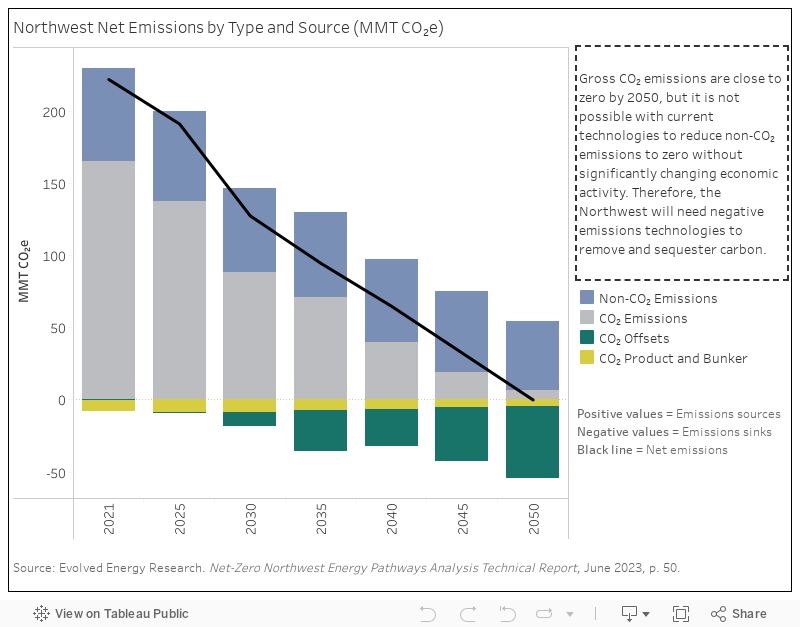
The Northwest gets very close to zero emissions by 2050 for energy and industry, but reducing non-CO2 emissions to zero will be very difficult in the agriculture sector and certain industrial processes. The Northwest will need early investment in negative emissions technologies to remove and sequester carbon.

.png)


Key Study Questions
NZNW Energy Pathways was designed to answer six key questions as follows:
What resources must be built to meet clean energy demand for different energy sectors in the Northwest in the coming three decades?
What is the impact of accelerated or constrained transmission expansion across the Western grid?
How does retaining gas compare with electrification as a decarbonization strategy in buildings?
What role can distributed energy resources (DERs) play in decarbonization?
What are the trade-offs between clean fuels, including biofuels and electrofuels/hydrogen?
What is the impact of the pace of transportation electrification on the overall cost of decarbonization for the Northwest?
Core Case
The analysis begins by developing a Core Case, which assumes relatively unconstrained technology is available in each of the modeled Northwest states, as well as in the larger 11-state Western region. The Core Case applies aggressive electrification and efficiency, and conservatively does not assume behavior change that would reduce energy demand. The analysis then explores 22 scenarios designed to answer the six key questions above.
Scenarios
Scenarios pose "What if?" questions that change assumptions in the Core Case to test different policy choices or market factors that impact technologies and energy resources. Each scenario must achieve net-zero emissions by 2050. It will be challenging to achieve the Core Case given siting and permitting, regional coordination, and other factors, so the scenarios shed light on what policymakers might need to address if options are more constrained. The full set of scenarios modeled with the NZNW Energy Pathways analysis with the key questions that were investigated is here.
Resources and Supply- and Demand-Side Assumptions
Examples of resources are utility-scale renewables, such as onshore and offshore wind, geothermal, solar PV, or electricity storage. Storage can include a variety of different types of batteries, as well as pumped hydro and thermal storage. The full list of optimized resources are listed on page 247 of the NZNW Energy Pathways Technical Report (Technical Report).
The model incorporates existing supply-side policies, such as clean energy standards, economy-wide greenhouse gas emissions reduction targets, and clean fuels standards, to name a few clean energy policies. There are also demand-side assumptions set in the Core Case. Examples include all electric appliance sales are fully electrified by 2035 and all light-duty vehicles are 100% zero-emission by 2035. The supply-side assumptions are on page 250 and the demand-side assumptions are on page 251 of the Technical Report.
EnergyPATHWAYS and RIO Models
Evolved Energy Research deploys two models in tandem to calculate the energy needed to power the Northwest economy and the least-cost way to provide that energy under clean electricity and emissions goals. EnergyPATHWAYS (EP) is a scenario analysis tool that is used to develop demand for fuels (electricity, pipeline gas, diesel fuel, etc.) over time. EP is a bottom-up energy model that characterizes stock rollover over time and simulates the change in total energy demand and load shape for every end use within 70 demand sub-sectors.
The Regional Investment and Operations (RIO) model is an optimization tool that identifies the cost-optimal energy supply required to meet energy demand. RIO develops portfolios of low-carbon technology for electricity generation and balancing, various fuels production, and direct air capture. RIO also identifies least-cost clean fuels to achieve emissions targets.
For details on how EP and RIO work separately and together; a list of the key energy-consuming subsectors; an explanation for how the models approach reliability and integrate electricity and liquid and gaseous fuels; and the methodology modeling overview, see pages 253-272 of the Technical Report.
Model Geography
The NZNW Energy Pathways analysis models the 11 Western U.S. states—Arizona, California (with two zones-California North and California South), Colorado, Idaho, Montana, Nevada, New Mexico, Oregon, Utah, Washington, and Wyoming—and the rest of the country as a single zone. This approach contextualizes the decisions made in the Northwest operating as part of a larger energy system.
Greenhouse Gas Emissions Reduction Targets
The study assumes that all states will achieve net-zero emissions by 2050. Net-zero emissions in this study means that all remaining greenhouse gases released into the atmosphere from human activity must be offset by measures to remove carbon from the atmosphere. Aspects of economic activity—for example, livestock emissions—are hard or expensive to decarbonize and may remain in 2050.
Net-zero requires that these remaining emissions are offset by carbon that is removed from the atmosphere and sequestered. The target of net-zero emissions by 2050 is in line with meeting the Intergovernmental Panel on Climate Change (IPCC) guidance on maintaining a 1.5C temperature rise.
For 2030, the study applies existing state greenhouse gas emissions targets for states that have them (e.g., 45% below 1990 levels by 2030 in Washington), and for those that do not (Idaho and Montana in the Northwest), 40% below 1990 by 2030.
Total Northwest emissions estimated as of 2021—where the analysis starts—are seen on page 277 of the NZNW Energy Pathways Technical Report (Technical Report). Pages 278 and 279 show the emissions reduction trajectories for each of the four Northwest states, starting in 2019, 2020, or 2021, depending upon the emissions inventory that were available at the time of this study.
Clean Electricity Policy and Inflation Reduction Act
The analysis applies the clean electricity policies that each state has passed for 2030 where they exist, which can be seen on page 280 of the Technical Report. The number of states with 100% clean electricity targets comprise approximately 75% of the total 2020 Western Electricity Coordinating Council (WECC) load. In 2050, the model assumes all states have 100% clean electricity.
The NZNW Energy Pathways analysis incorporates the Inflation Reduction Act, which is detailed on pages 281 and 282 of the Technical Report.
Study Assumptions
The studies that Evolved Energy Research consulted when developing the NZNW Energy Pathways model begin on page 284 of the Technical Report.
Examples of data that Evolved relied on include the Environmental Protection Agency’s supply curve of mitigation measures for non-CO2 reductions; The Nature Conservancy’s Power of Place study for transmission cost assumptions as well as reforestation; the Northwest Power and Conservation Council’s 2021 Northwest Power Plan for rooftop solar adoption; and many other data sources, which are detailed from pages 284-295.


